The PPI-120 Awards: Honoring the Best of 2006
A season-by-season celebration of the best performances in PFL through the lens of the PPI-120 grading system.
________________________________________
What is PPI-120?
Every season gives us numbers. PPI-120 is my way of turning those numbers into something more meaningful. Instead of just looking at the loudest stat total and calling it a day, the goal is to judge how strong a full season really was within the context of each position. Some positions are built on efficiency. Others are built on volume. Some depend on splash plays, while others depend on consistency and completeness.
That is why PPI-120 is useful. It gives structure to the conversation while still leaving plenty of room for debate.
As a rough guide:
100+ = elite
90-99 = very good
80-89 = good
70-79 = above average
The goal is not just to dump raw stats on a page. It is to measure the overall quality of a season. That does not mean the system is perfect. Some positions are easier to capture with numbers than others, and for certain roles playing time matters more than pure efficiency. Still, no grading system is perfect. This is meant to be fun, but it is also the result of a lot of time spent trying to build something consistent.
So with that out of the way, let’s treat this like it should be treated:
The PPI-120 Awards
________________________________________
QUARTERBACK
The quarterback reference point still belongs to Daunte Culpepper’s 2009 explosion from the SFL, the sort of season that continues to sit above almost every other passing year in the larger pool. Over 5,300 yards, 46 touchdowns, only 12 interceptions, and a 110.4 QBR is not just elite production, it is the kind of line that defines the ceiling for the position.
2006 Nominees
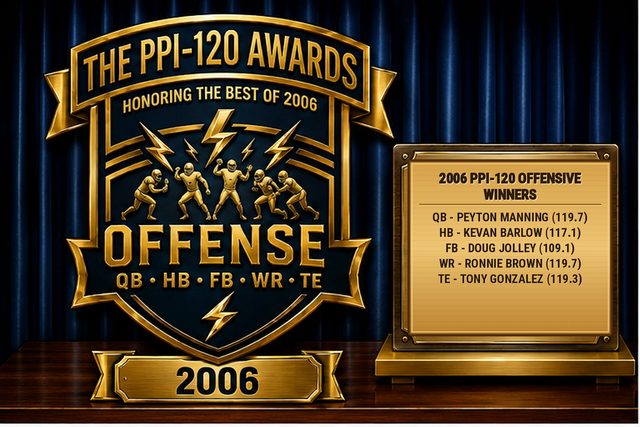
Peyton Manning — 119.7
Matt Hasselbeck — 118.8
Drew Brees — 109.7
Kurt Warner — 106.5
Daunte Culpepper — 104.0
Winner: Peyton Manning — 119.7 PPI-120
Manning produced a season that came within a fraction of the maximum score. His 4,618 passing yards, 42 touchdowns, 12 interceptions, and 116.4 rating gave him elite volume without sacrificing efficiency. Matt Hasselbeck finished remarkably close, but Manning’s superior rating and extra touchdown were enough to give him the strongest complete quarterback profile of 2006.
________________________________________
HALFBACK
The measuring stick at halfback still points back to Priest Holmes in 2003, a season that remains one of the clearest examples of volume and efficiency working together at the highest level. The one technical oddity is still Mario Fannin’s 2015 outlier, which is a good reminder that football reality and raw math do not always move in perfect sync.
2006 Nominees
Kevan Barlow — 117.1
Shaun Alexander — 116.4
LaDainian Tomlinson — 115.9
Edgerrin James — 115.4
T.J. Duckett — 110.6
Winner: Kevan Barlow — 117.1 PPI-120
Barlow wins an extremely competitive halfback category with the best overall balance of workload, efficiency, ball security, and production. He carried the ball 334 times for 1,623 yards, averaged 4.86 yards per attempt, scored 10 touchdowns, and lost ground through only one fumble. Shaun Alexander, LaDainian Tomlinson, and Edgerrin James all made compelling cases, but Barlow’s combination of volume and control gave him the edge.
________________________________________
FULLBACK
The fullback benchmark still belongs to Mewelde Moore in 2008, a season that captured everything that makes the position interesting to grade. Blocking, short-yardage help, rushing value, and receiving contribution all showed up in one complete package.
2006 Nominees
Doug Jolley — 109.1
Chris Fuamatu-Maʻafala — 104.7
Dan Kreider — 103.7
George Layne — 93.1
Rock Cartwright — 89.2
Winner: Doug Jolley — 109.1 PPI-120
Jolley successfully defends his fullback award after also leading the position in 2005. His 61 pancakes were backed by 123 rushing yards and another 101 through the air, giving him the most complete offensive contribution in the group. Chris Fuamatu-Maʻafala and Dan Kreider produced slightly larger blocking totals, but Jolley separated himself with far more value as a runner and receiver.
________________________________________
WIDE RECEIVER
Reggie Wayne’s 2002 season still stands as the receiving standard, the sort of year that remains impossible to ignore when discussing the highest peak at wide receiver. Huge catch volume, explosive yardage, and touchdown production all came together in the way a true benchmark season should.
2006 Nominees
Ronnie Brown — 119.7
Amani Toomer — 118.7
Donte Stallworth — 118.5
Torry Holt — 118.2
Randy Moss — 116.9
Winner: Ronnie Brown — 119.7 PPI-120
Brown delivered one of the most explosive receiving seasons in the entire 2006 field. He caught 86 passes for 1,870 yards and an extraordinary 20 touchdowns, combining deep-play damage with dominant scoring production. Amani Toomer offered greater catch volume and the rest of the nominees were excellent, but nobody matched the force of Brown’s yardage-and-touchdown combination.
________________________________________
TIGHT END
Tony Gonzalez’s 2006 season is the model here, the type of tight end year that blends receiving production with real blocking value. That combination is what makes the position unique, and it is why the best tight end seasons feel more complete than a pure pass-catching profile.
2006 Nominees
Tony Gonzalez — 119.3
B.J. Askew — 115.2
Antonio Gates — 114.3
Marcedes Lewis — 114.1
Courtney Anderson — 113.8
Winner: Tony Gonzalez — 119.3 PPI-120
Gonzalez did not merely win the 2006 tight end award; he produced the season that became the position’s reference point. His 64 catches, 1,160 receiving yards, seven touchdowns, and 56 pancakes created a rare combination of top-level receiving output and meaningful blocking work. The field behind him was deep, but Gonzalez was the one player who truly excelled in every major part of the position.
________________________________________
OFFENSIVE LINE AWARDS
LEFT TACKLE
The left tackle gold standard still belongs to Morgan Moses in 2019, a season that continues to define what top-end tackle play looks like when run-blocking force and pass-protection steadiness come together.
2006 Nominees
Orlando Pace — 119.8
Chris Samuels — 112.1
Matt Light — 111.9
Makoa Freitas — 106.9
David Diehl — 106.5
Winner: Orlando Pace — 119.8 PPI-120
Pace came as close as possible to a perfect score without quite reaching it. He piled up 114 pancakes while allowing only two sacks, a combination that made him both the most powerful and the most secure left tackle in the field. The gap between Pace and the rest of the nominees reflects just how complete his season was.
LEFT GUARD
Willie Roaf’s 2002 season still serves as the left guard benchmark, the kind of year that set the tone for what elite interior line play is supposed to look like.
2006 Nominees
Ephraim Salaam — 107.7
Jordan Gross — 107.7
Stacy Andrews — 100.1
Logan Mankins — 100.1
Wesley Britt — 98.4
Co-Winners: Ephraim Salaam and Jordan Gross — 107.7 PPI-120
There is no honest way to separate Salaam and Gross in this category. Both finished with 75 pancakes, both allowed three sacks, and both received the same 107.7 PPI-120 grade. Stacy Andrews and Logan Mankins created another exact tie behind them, making this one of the most tightly grouped offensive-line awards of the season. At the top, Salaam and Gross share the stage.
CENTER
Larry Allen’s 2003 season still stands at the center position as the old reference point, a reminder of how much interior control one player can impose over a season.
2006 Nominees
Brad Meester — 116.5
Olin Kreutz — 103.8
Ryan Pontbriand — 102.8
Dominic Raiola — 98.6
Shaun O’Hara — 92.7
Winner: Brad Meester — 116.5 PPI-120
Meester was the clearest offensive-line winner outside Orlando Pace. He produced 58 pancakes and allowed only two sacks, giving him a powerful advantage over the rest of the center field. Olin Kreutz and Ryan Pontbriand both cleared the elite threshold, but Meester’s blend of blocking volume and protection was on another level.
RIGHT GUARD
The right guard reference point remains Willie Roaf in 2006, still one of the clearest examples of how overwhelming an interior lineman can look when both sides of the formula cooperate.
2006 Nominees
Brandon Moore — 102.0
Adam Timmerman — 96.8
Justin Hartwig — 93.4
Kendall Simmons — 87.6
Roberto Garza — 85.7
Winner: Brandon Moore — 102.0 PPI-120
Moore was the only right guard in this PFL field to reach the elite range. His 64 pancakes gave him the best blocking total among the leading candidates, and four sacks allowed were manageable enough to preserve the top overall profile. It was not the most dominant position group of 2006, but Moore was still a clear and deserving winner.
RIGHT TACKLE
Jonathan Ogden’s 2002 campaign still sets the tone here, the type of season that continues to hang over the right tackle position whenever an elite year is discussed.
2006 Nominees
Willie Anderson — 93.0
Jon Jansen — 85.4
Dustin Rykert — 83.2
Tarik Glenn — 80.8
Tra Thomas — 80.2
Winner: Willie Anderson — 93.0 PPI-120
Anderson wins a difficult right tackle year in which no player reached the elite threshold. His 79 pancakes were the best total in the top five, and although seven sacks allowed kept the final grade down, his run-blocking force still gave him a meaningful advantage. Jon Jansen came closest, but Anderson retained the strongest total case.
________________________________________
DEFENSE
DEFENSIVE TACKLE
If offensive football is often about space, timing, rhythm, and finesse, defensive tackle play is often the exact opposite. It is force. It is leverage. It is disruption in its purest form. The best defensive tackles do not always live off pretty stat lines, but when they pile up production on top of interior dominance, they become terrifying.
The interior benchmark still belongs to Ty Warren’s 2008 season, the kind of year that remains the template for defensive tackle excellence. It is the sort of season that reminds you how devastating true interior pressure can be.
2006 Nominees
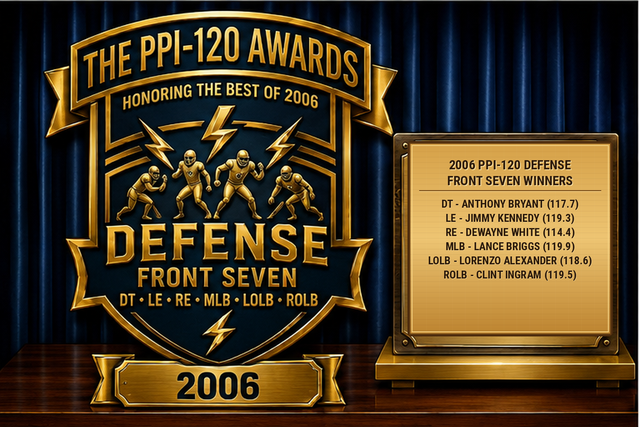
Anthony Bryant — 117.7
Wendell Bryant — 117.1
Darwin Walker — 116.4
Aaron Smith — 115.7
Darnell Dockett — 115.5
Winner: Anthony Bryant — 117.7 PPI-120
Bryant claims the award in a category loaded with interior pass-rush production. His 52 tackles, eight tackles for loss, and 11 sacks gave him the most balanced profile in the top five. Wendell Bryant recorded two more sacks, but Anthony’s larger tackle and backfield-impact totals made his overall season more complete.
________________________________________
LEFT END
The left end position is where destruction often becomes artistry. The best ones do not just rush the passer. They ruin protections, squeeze runs from the backside, force quarterbacks into panic decisions, and turn clean pockets into chaos. Michael Strahan’s 2004 season still stands as the standard at left end, the kind of campaign that defines what an elite edge year is supposed to feel like.
2006 Nominees
Jimmy Kennedy — 119.3
Dwight Freeney — 118.9
Ty Warren — 117.5
Adalius Thomas — 116.5
Richard Seymour — 113.6
Winner: Jimmy Kennedy — 119.3 PPI-120
Kennedy survived one of the closest and most destructive races of the season. He finished with 17 sacks, 10 tackles for loss, and an extraordinary five fumble recoveries. Dwight Freeney brought more tackles, forced fumbles, and pass deflections, but Kennedy’s combination of sack production and recovered possessions nudged him ahead by four-tenths of a point.
________________________________________
RIGHT END
At right end, the historical reference remains Julius Peppers in 2004, a season so varied and complete that it still feels like the blueprint for the position.
2006 Nominees
Dewayne White — 114.4
Trevor Pryce — 114.3
Andre Carter — 113.2
Derrick Burgess — 112.3
Brett Keisel — 108.0
Winner: Dewayne White — 114.4 PPI-120
Only one-tenth separated White from Trevor Pryce. Pryce had the larger sack total, but White balanced his eight sacks with six tackles for loss, a fumble recovery, and a defensive touchdown. That scoring play became the small but decisive difference in a category where the two leading profiles were otherwise almost inseparable.
________________________________________
MIDDLE LINEBACKER
Middle linebacker is one of the most difficult positions to grade because the best seasons can look different from one another. Some are built on tackle dominance. Some are driven by coverage plays. Some are defined by range, run fits, and play volume. Others create a rare hybrid with splash plays on top.
The standard at middle linebacker still points back to Angelo Crowell in 2009, a season that continues to represent the ideal of total production from the center of a defense.
2006 Nominees
Lance Briggs — 119.9
Alfred Fincher — 119.1
Solomon Bates — 118.7
Jeremiah Trotter — 117.8
Kawika Mitchell — 116.1
Winner: Lance Briggs — 119.9 PPI-120
Briggs missed a perfect score by only one-tenth. His 137 tackles, 18 tackles for loss, two interceptions, five forced fumbles, two recoveries, six deflections, and a safety created a season with virtually no weakness. Alfred Fincher and Solomon Bates added more coverage fireworks and even defensive touchdowns, but Briggs’ total volume and turnover creation gave him the strongest complete profile.
________________________________________
RIGHT OUTSIDE LINEBACKER
Right outside linebacker in this model is treated more like an edge-OLB role, meaning pass-rush impact matters more, but it still rewards versatility. That makes this one of the most fun categories in the whole awards series, because the best seasons often mix pressure, range, and coverage. The benchmark here remains Phillip Dillard in 2018, a season that still feels like it was built specifically to break a grading system.
2006 Nominees
Clint Ingram — 119.5
Joe Odom — 118.0
James Davis — 116.6
E.J. Henderson — 113.6
London Fletcher — 111.9
Winner: Clint Ingram — 119.5 PPI-120
Ingram’s season had exactly the versatility this category is designed to reward. He produced 80 tackles, 11 tackles for loss, eight sacks, two interceptions, a recovery, and 11 pass deflections. Joe Odom made a serious challenge with his own all-around production, but Ingram’s superior pressure numbers carried him to an excellent 119.5 score.
________________________________________
LEFT OUTSIDE LINEBACKER
Marcus Washington’s 2003 season still holds the top spot as the all-time left outside linebacker standard, a year that continues to represent the full range of what the position can be.
2006 Nominees
Lorenzo Alexander — 118.6
Brian Urlacher — 118.5
LaVar Arrington — 118.3
Troy Polamalu — 117.5
Nathaniel Adibi — 116.3
Winner: Lorenzo Alexander — 118.6 PPI-120
Three-tenths covered the top three, and only one-tenth separated Alexander from Brian Urlacher. Alexander combined 63 tackles and seven sacks with four interceptions, two forced fumbles, and eight deflections. Urlacher had overwhelming tackle and backfield volume, while LaVar Arrington brought nine sacks and 15 deflections, but Alexander’s rare blend of pass rush and takeaway production gave him the narrowest of victories.
________________________________________
CORNERBACK
Cornerback is where the PPI-120 model becomes especially interesting, because it is not enough just to count interceptions. That can be noisy. It can be volatile. Instead, the system also looks at deflections and coverage results, including the allowed-catch component through the CTHA rate. In other words, this is not just a ball-hawk award. It is a coverage award.
The cornerback reference point still belongs to Byron Jones in 2019, a season that remains one of the clearest examples of lockdown play and ball production existing at the same time.
2006 Nominees
Ken Hamlin — 119.7
Nate Clements — 119.1
Ken Lucas — 119.0
Andre Woolfolk — 118.9
Quentin Jammer — 118.8
Winner: Ken Hamlin — 119.7 PPI-120
Hamlin’s season was built for this model. He recorded eight interceptions, 39 deflections, and two defensive touchdowns while allowing only 31 catches at a 39.2 percent rate. Nate Clements produced four touchdowns and the rest of the top five remained extremely close, but Hamlin combined elite ball production with the best overall coverage profile in the group.
________________________________________
FREE SAFETY
Free safety seasons can sometimes get overshadowed because they are less flashy on the surface than edge or corner seasons. But the great ones are beautiful in their own way. They erase mistakes. They close windows. They bait throws. They turn the deep middle into a trap. Kenny Vaccaro’s 2014 season still serves as the reference point here, a year that continues to define what elite coverage impact from free safety looks like.
2006 Nominees
Greg Wesley — 119.2
Sammy Knight — 114.9
Mike Brown — 113.8
Ronnie Heard — 111.1
Stuart Schweigert — 110.9
Winner: Greg Wesley — 119.2 PPI-120
Wesley dominated the free safety category through extraordinary coverage efficiency. He intercepted four passes, broke up 28 more, and allowed only four catches, producing a remarkable 10.8 percent CTHA rate. The other nominees had strong seasons, but nobody else combined that level of disruption with such a small number of completions allowed.
________________________________________
STRONG SAFETY
Strong safety is where the secondary starts to blend with the front seven. The best strong safeties are not just deep defenders. They hit, tackle, trigger downhill, and still make coverage plays. They live in more than one world. John Lynch’s 2003 campaign still stands as the benchmark here, the kind of strong safety season that captures both physical authority and playmaking range.
2006 Nominees
Adrian Wilson — 116.5
Dawan Landry — 116.4
Darren Sharper — 116.0
Corey Chavous — 115.2
Colin Branch — 114.9
Winner: Adrian Wilson — 116.5 PPI-120
Wilson wins by the smallest margin of any 2006 secondary category. His 68 tackles, three interceptions, 16 deflections, two takeaways, and a defensive touchdown created a wonderfully balanced season. Dawan Landry’s six interceptions and excellent coverage rate brought him within one-tenth, but Wilson’s broader contribution across tackling, coverage, turnovers, and scoring gave him the final edge.
________________________________________
FINAL THOUGHTS
Every season leaves behind a different kind of memory. Some are remembered for one great team. Some for one iconic playoff run. Others survive because of individual brilliance, the type of year that still stands out long after the standings have faded into the background. That is what makes a project like PPI-120 worthwhile. It gives us another way to revisit a season and ask a sharper question. Not just who was the most famous. Not just who had the loudest single stat. But who actually built the strongest season when everything that matters at that position is weighed together.
And 2006 gave us a particularly strong collection of close races. Peyton Manning and Matt Hasselbeck pushed one another at quarterback. The halfback field placed four major seasons within less than two points. Left guard produced exact ties, right end was decided by one-tenth, Lorenzo Alexander edged Brian Urlacher by the same margin, and Adrian Wilson barely escaped a brilliant challenge from Dawan Landry. Even in categories with clear winners, the depth behind them made the awards feel earned rather than automatic.
There were also seasons that went beyond simply winning a category. Tony Gonzalez produced the tight end campaign that serves as the position’s benchmark. Lance Briggs finished one-tenth below perfection. Orlando Pace reached 119.8 from the offensive line, while Ronnie Brown and Ken Hamlin both reached 119.7 in completely different ways. That contrast is one of the best things about the system. Greatness at wide receiver cannot look like greatness at cornerback, yet both can still be measured within the demands of their own positions.
That is why these awards work best when every position receives its own moment. A dominant tackle season does not look like a dominant safety season. A linebacker can reach the top through range and volume, while an edge defender can get there through pressure and disruption. Football is too layered to be reduced to one list, and the PPI-120 approach is most useful when it respects those differences.
The point is not to end the argument. The point is to make the argument more interesting. To give it more structure. To make us think harder about what matters most at each position. To look back and ask not just who was good, but who truly had the season.
And for 2006, these were the players who earned their place on the stage.
________________________________________
The PPI-120 Awards
Honoring the Best of 2006


|